Category: Dashboard
New: Sports Betting Metrics Added to Nixvir Dashboard
We’ve added a new Sports Betting Activity section to the Nixvir Dashboard, tracking gaming metrics as a competing discretionary spend indicator for the ski industry.
Why track sports betting? A significant market for new skiers and snowboarders is adult males ages 18-35. To the extent that some of these individuals are more focused on sports betting than in the past, it may reduce their discretionary income and therefore reduce their participation frequency—or their likelihood of picking up skiing or snowboarding at all.
Category: Ski Industry
New: Sports Betting Metrics Added to Nixvir Dashboard
We’ve added a new Sports Betting Activity section to the Nixvir Dashboard, tracking gaming metrics as a competing discretionary spend indicator for the ski industry.
Why track sports betting? A significant market for new skiers and snowboarders is adult males ages 18-35. To the extent that some of these individuals are more focused on sports betting than in the past, it may reduce their discretionary income and therefore reduce their participation frequency—or their likelihood of picking up skiing or snowboarding at all.
U.S. vs. Canadian Winter 2025/26 Weather Forecasts for November through January and Impacts on the Ski Industry
Click here to read the full analysis comparing NOAA and Environment Canada CanSIPS forecasts for the 2025/26 winter season.
Category: Economy
U.S. Inflation Data Shows Cooling, But Reliability Questioned
The Labor Department reported November’s consumer price index rose 2.7% year-over-year, down from September’s 3%. However, economists questioned the reliability of this data due to a 43-day federal shutdown that delayed the report and disrupted data collection.
“The good news is that it’s cooling. We’ll take a win when we can get it,” said Diane Swonk from KPMG, but added “we just don’t know how much of it to trust.” Kay Haigh at Goldman Sachs described the numbers as “noisy” with potential systematic biases.
Category: Inflation
U.S. Inflation Data Shows Cooling, But Reliability Questioned
The Labor Department reported November’s consumer price index rose 2.7% year-over-year, down from September’s 3%. However, economists questioned the reliability of this data due to a 43-day federal shutdown that delayed the report and disrupted data collection.
“The good news is that it’s cooling. We’ll take a win when we can get it,” said Diane Swonk from KPMG, but added “we just don’t know how much of it to trust.” Kay Haigh at Goldman Sachs described the numbers as “noisy” with potential systematic biases.
Category: Social Media
Americans' Social Media Use 2025
Growing shares of U.S. adults say they are using Instagram, TikTok, WhatsApp and Reddit, but YouTube still rises to the top.
YouTube remains the dominant platform with 84% of U.S. adults reporting they use it, followed by Facebook at 71%. Half of Americans now use Instagram, while TikTok has grown to 37% adoption. WhatsApp (32%), Reddit (26%), and Snapchat (25%) round out the mid-tier platforms, with X (formerly Twitter) at 21%. Newer platforms like Threads (8%), Bluesky (4%), and Truth Social (3%) have yet to achieve mainstream adoption.
Category: Technology
Americans' Social Media Use 2025
Growing shares of U.S. adults say they are using Instagram, TikTok, WhatsApp and Reddit, but YouTube still rises to the top.
YouTube remains the dominant platform with 84% of U.S. adults reporting they use it, followed by Facebook at 71%. Half of Americans now use Instagram, while TikTok has grown to 37% adoption. WhatsApp (32%), Reddit (26%), and Snapchat (25%) round out the mid-tier platforms, with X (formerly Twitter) at 21%. Newer platforms like Threads (8%), Bluesky (4%), and Truth Social (3%) have yet to achieve mainstream adoption.
Category: Economics
Growing Wealth — and Inequality
The percentage of US households earning more than $150,000 has grown significantly since 1965, while the middle class ($50,000 to $149,999) has been steadily shrinking. This chart from the US Census Bureau (in 2024 dollars) reveals a fundamental shift in American income distribution.
Michael W. Green’s analysis in “My Life Is a Lie” examines how an outdated poverty measurement formula has masked the true cost of living in modern America. The real threshold for basic financial survival is approximately $140,000 annually for a family of four—far above the official $31,200 poverty line established using 1963 methodology.
Generational Spending Trends
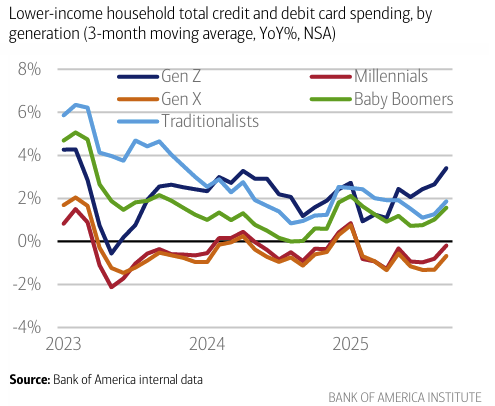
Bank of America study shows all generations, aside from Gen Z, have seen a softening in their spending growth over 2025, however the rate of growth is weakest for Millennial and Gen X households. Click here for full article.
Category: Inequality
Growing Wealth — and Inequality
The percentage of US households earning more than $150,000 has grown significantly since 1965, while the middle class ($50,000 to $149,999) has been steadily shrinking. This chart from the US Census Bureau (in 2024 dollars) reveals a fundamental shift in American income distribution.
Michael W. Green’s analysis in “My Life Is a Lie” examines how an outdated poverty measurement formula has masked the true cost of living in modern America. The real threshold for basic financial survival is approximately $140,000 annually for a family of four—far above the official $31,200 poverty line established using 1963 methodology.
Category: Climate
U.S. vs. Canadian Winter 2025/26 Weather Forecasts for November through January and Impacts on the Ski Industry
Click here to read the full analysis comparing NOAA and Environment Canada CanSIPS forecasts for the 2025/26 winter season.
Category: Consumer Spending
Generational Spending Trends
Bank of America study shows all generations, aside from Gen Z, have seen a softening in their spending growth over 2025, however the rate of growth is weakest for Millennial and Gen X households. Click here for full article.